Welcome to SkeletalVis : a user friendly web application for exploration of skeletal biology related expression datasets.
How does it work?
SkeletalVis is simple to use.
Explore and look for similarities between existing gene expression datasets
Compare by gene across all the expression datasets or enter your own differentially expressed genes to search for similar experiments
What data does SkeletalVis contain?
SkeletalVis uses public microarray and RNA-Seq expression data from ArrayExpress and GEO
These repositories are searched for skeletal experiments which are then consistently analysed
Citation
Jamie Soul, Tim Hardingham, Ray Boot-Handford, Jean-Marc Schwartz
SkeletalVis: An exploration and meta-analysis data portal of cross-species skeletal transcriptomics data, Bioinformatics
https://doi.org/10.1093/bioinformatics/bty947
Created by the Pathways and biological systems modelling group
Funded by the European Community’s Seventh Framework Programme grant (602300)

Searching ...
Searching ...
Display tooltips
-
Hover over the icons to display tool tips in the app
Explore
-
The explore section of the app allows browsing of pre-analysed transcriptomics data and comparison between these datasets.

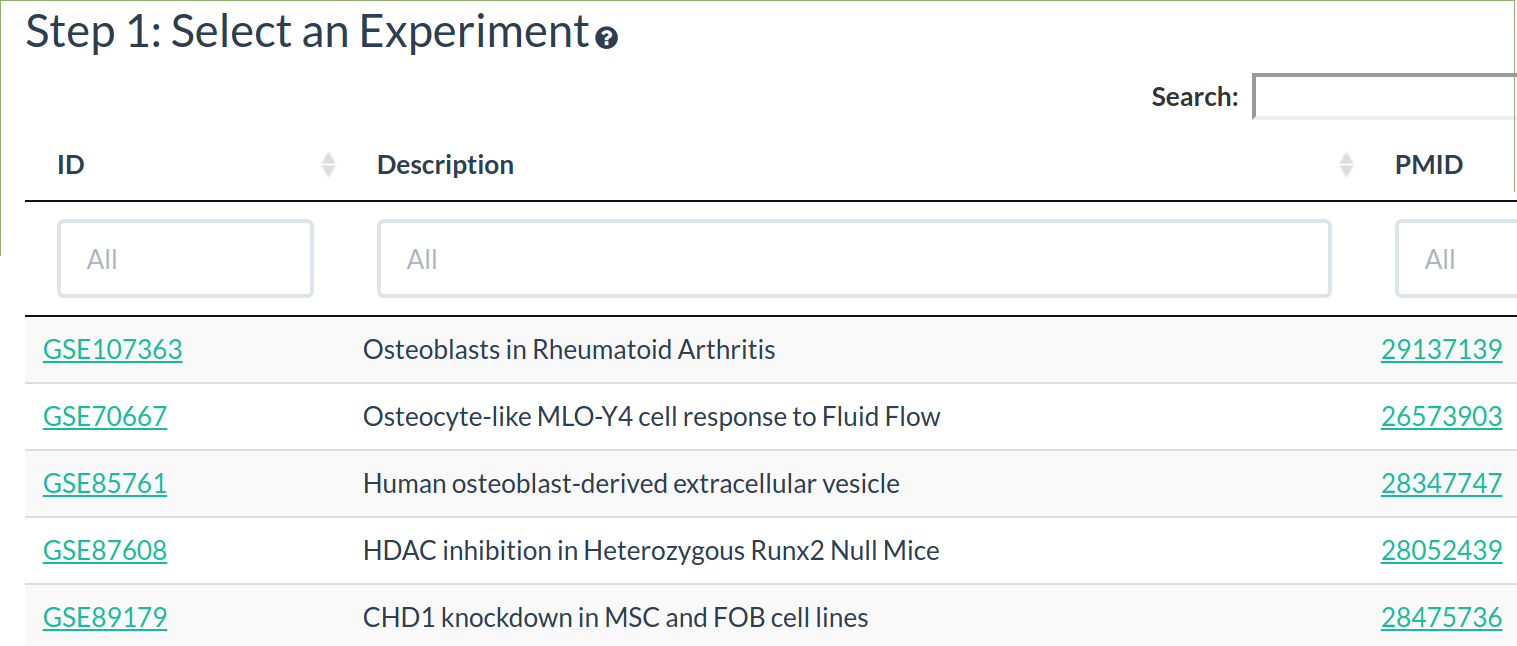
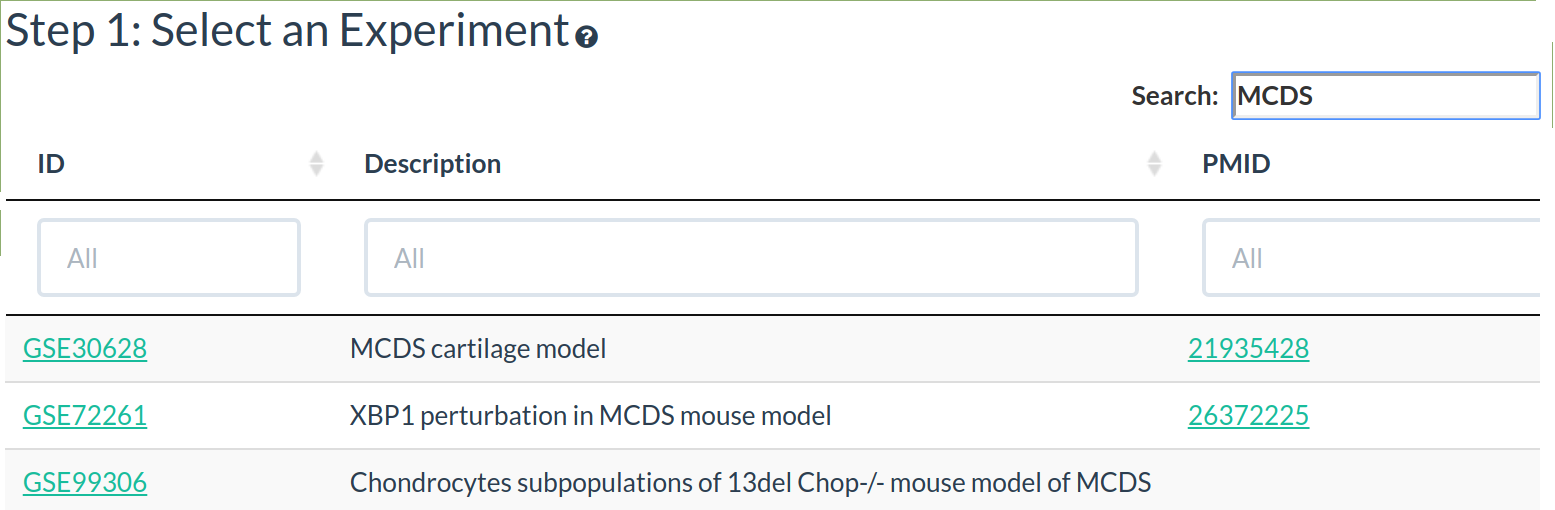
Step 1: Search and choose data
-
The experiment table shows the analysed datasets available to explore.
-
To help find an experiment of interest the whole table can be searched or a column can be sorted/searched.
-
Click on a row in the experiment table to select that experiment
-
The comparisons in the experiment will be displayed in the comparisons table
-
A comparison to view can be chosen by selecting a row in the comparison table.
-
The selected experiment and comparison will be displayed in the left hand information panel.
-
The selected experiment and comparison data will be now be loaded
Step 2: View the experiment metadata, quality control and PCA plots
-
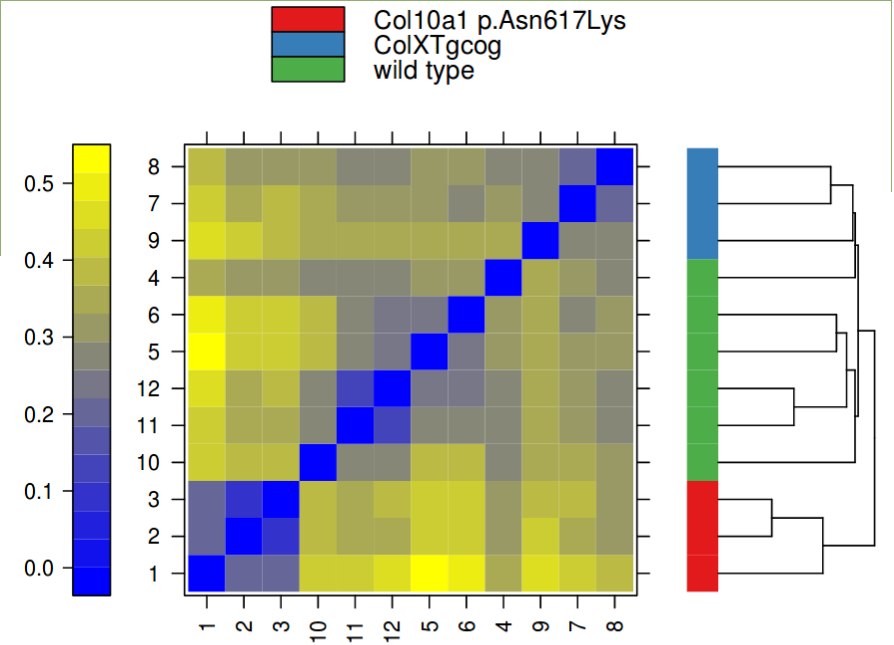
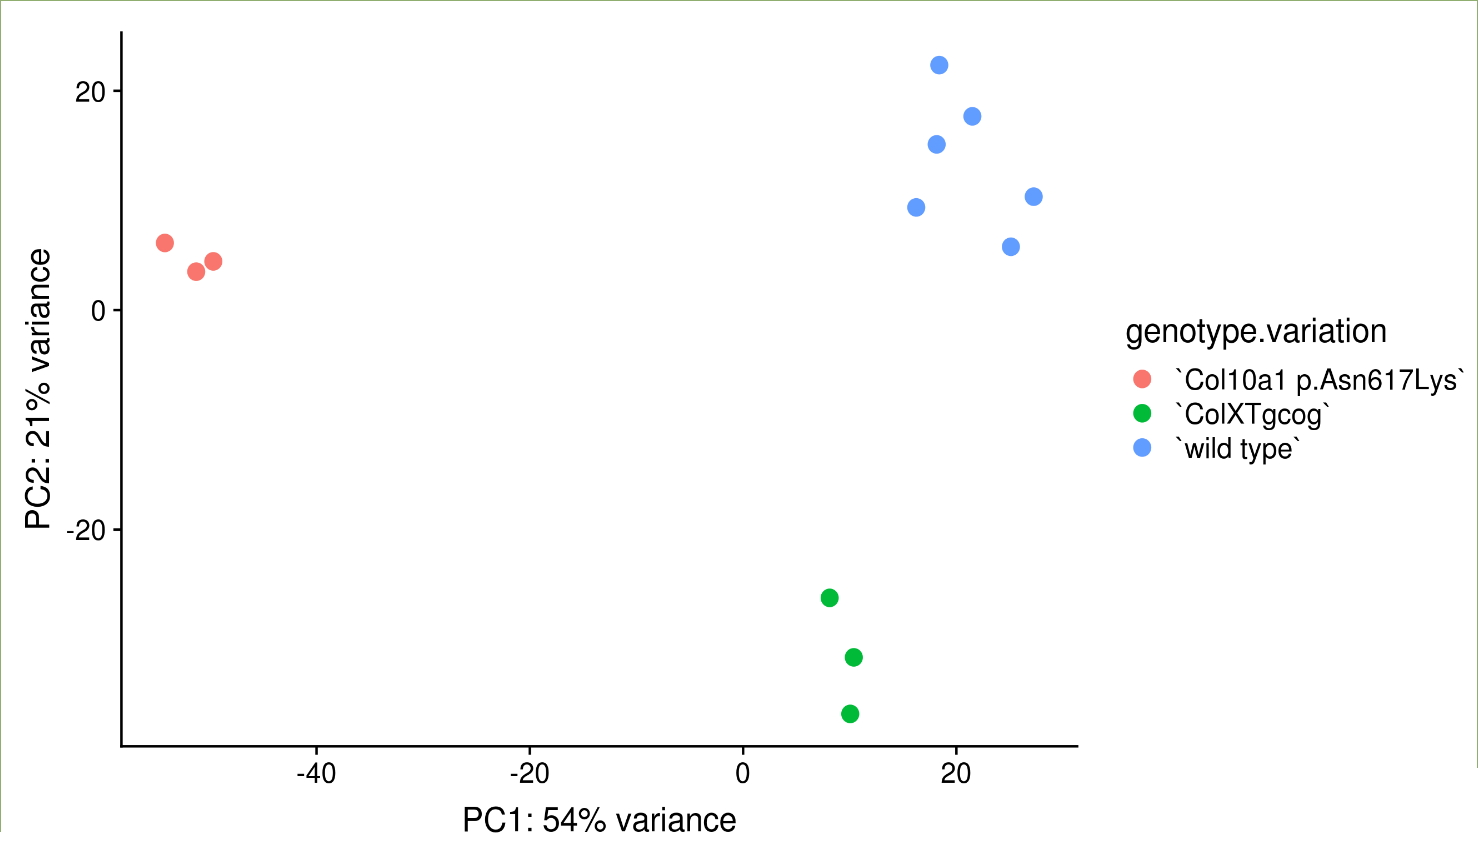
The QC data and the PCA plot after normalisation and batch effect correction can be viewed by clicking the corresponding tabs.
-
The QC allows assessment of the data quality
-
The PCA shows the seperation of the samples by the top two components explaining the variation after any batch effect correction
Step 3: View the expression response and downstream analysis
-
Select selected expression response can be explored by examining the fold-change, pathway, gene ontology enrichments, transcription factor predictions and enriched drugs.
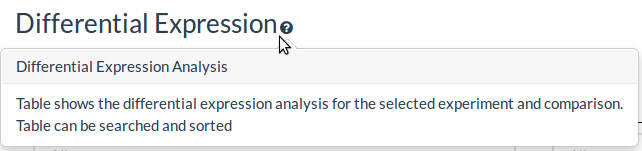
Differential Expression
-
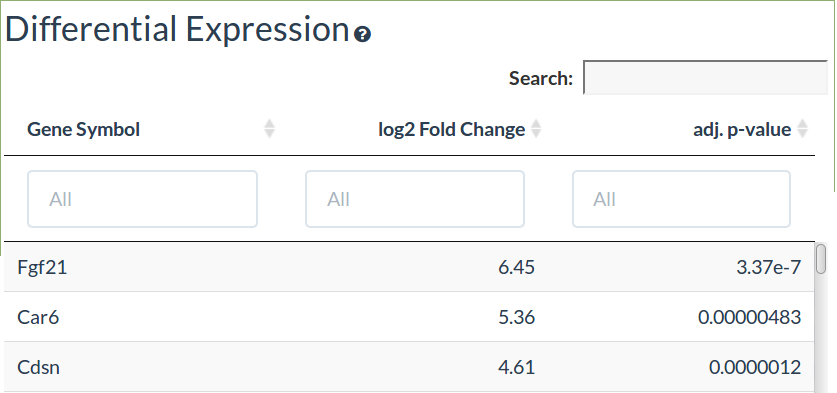
The differential expression table shows the gene names, log2 fold changes and if there are experimental replicates the Benjamini-Hochberg adjusted p-values.
-
Differential expression analysis is performed using DESeq2 for RNA-seq and limma for microarray.
-
The table can be searched using the search box, sorted by clicking the columns and filtered using the column filters.
-
The copy and csv buttons at the bottom of the table allow export of visible filtered table
Characteristic Direction
-
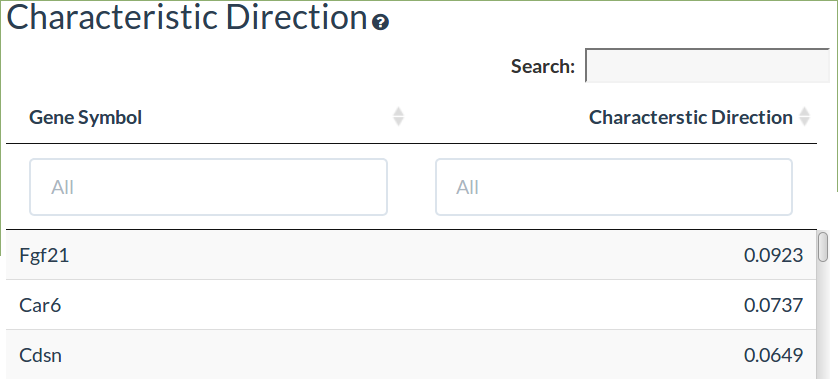
The characteristic direction method gives the genes that best seperate the samples in the comparison and has been shown to be more sensitive than limma/DESeq2 in identifying differentially expressed genes. The top 500 genes are shown which can be considered a differential expression signature of the expression response. Please see
http://doi.org/10.1186/1471-2105-15-79for details of the method
-
The table can be searched using the search box, sorted by clicking the columns and filtered using the column filters.
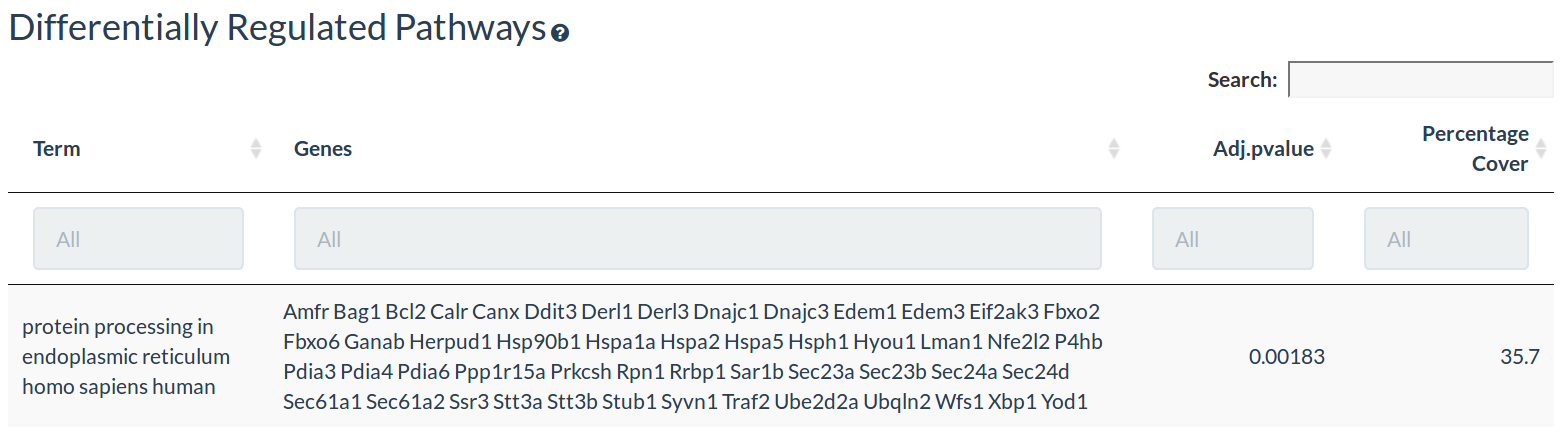
Differential Pathways
-
The pathway table shows the differentially regulated pathways, the differentially expressed in those pathways, the adjusted p-value and the percentage pathway coverage
-
The pathway enrichment is performed differentially expressed genes with a threshold of 1.5 fold change and an adjusted pvalue ≤0.05 (if applicable)
-
The table can be searched using the search box, sorted by clicking the columns and filtered using the column filters.
-
The copy and csv buttons at the bottom of the table allow export of visible filtered table
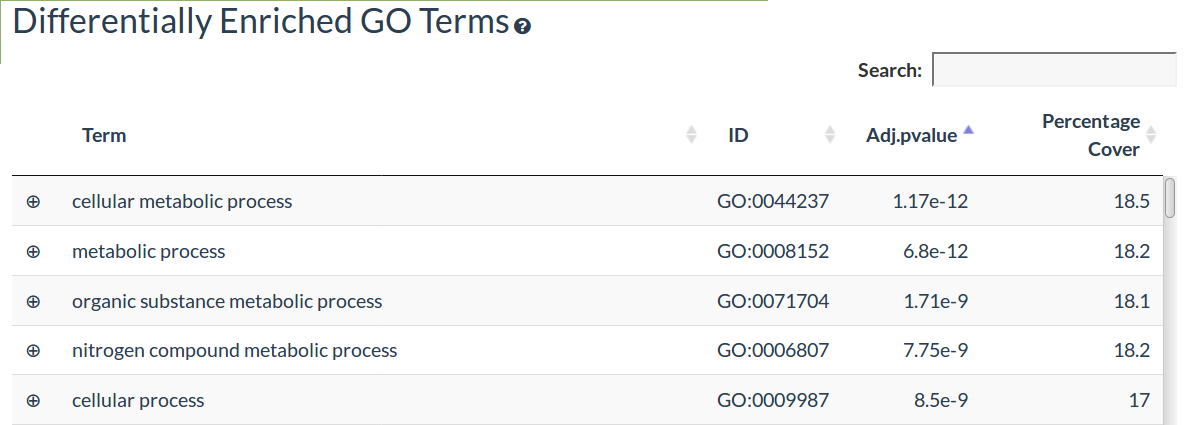
Enriched GO Terms
-
The GO Term enrichment table shows the differentially enriched Gene Ontology Biological Process terms, the adjusted p-value and the percentage of differentially expressed genes out of all genes annotated to that GO Term
-
Click on the left hand + symbol to view the differentially expressed genes annotated to that GO Term
-
The GO enrichment is performed differentially expressed genes with a threshold of 1.5 fold change and an adjusted pvalue ≤0.05 (if applicable)
-
The table can be searched using the search box, sorted by clicking the columns and filtered using the column filters.
-
The copy and csv buttons at the bottom of the table allow export of visible filtered table
-
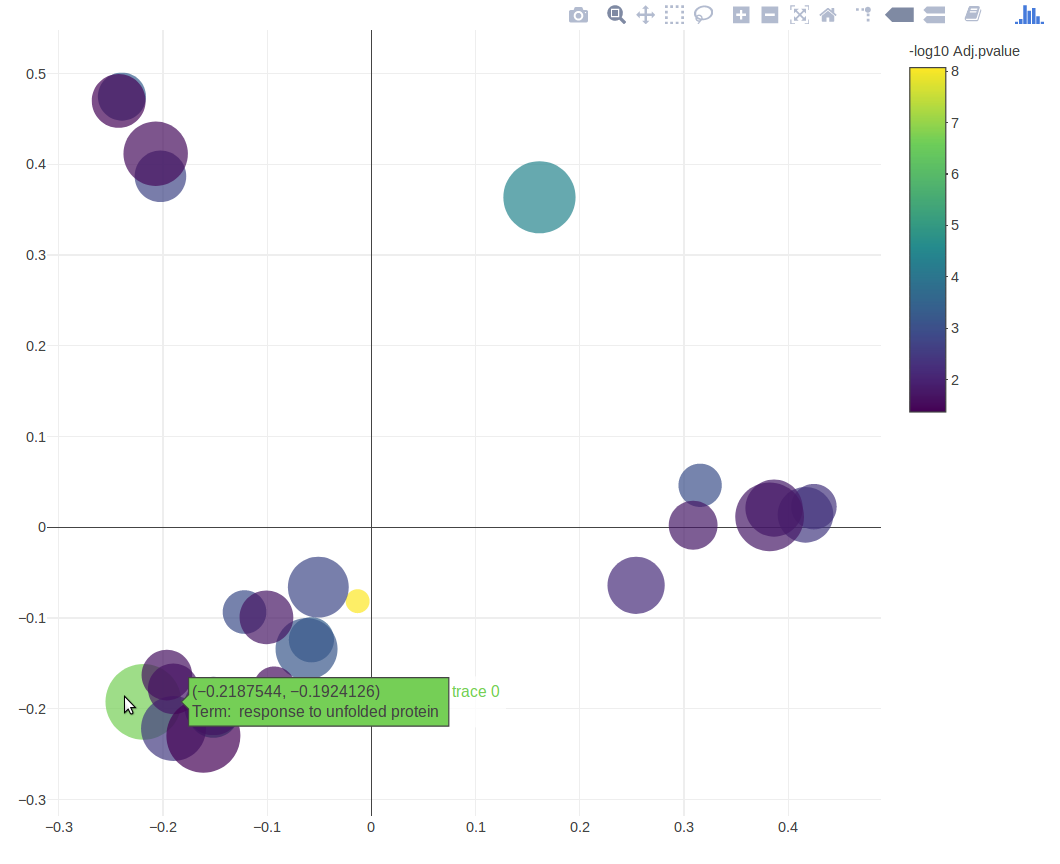
The Reduced GO Term enrichment table similarly shows GO Enrichment results after redundancy reduction based on the semantic similarity of the GO Terms
-
The GO MDS plots shows an overview of the reduced GO Terms, seperated based on their semantic simiarity so similar terms are grouped together
-
Hover over a point to show the name of the GO term
-
The points are coloured by adjusted p-value
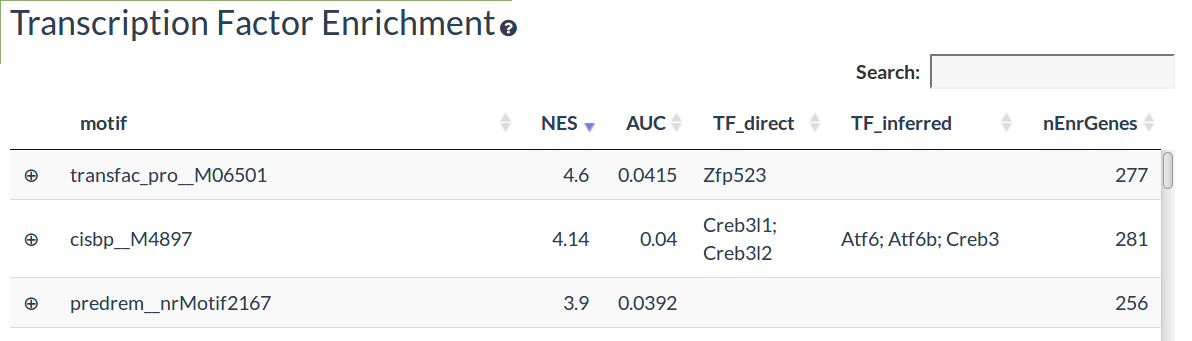
Enriched Transcription Factors
-
The transcription factor (TF) enrichment table shows the transcription factor motifs predicted to significantly regulate the differentially expressed genes using RcisTarget
-
The NES gives the significance of the enrichment for each motif
-
The known TF corresponding to motifs are given in the TF_direct column
-
Inferred TF annotations through motif simialrity are given in the TF_indirect column
-
Click on the left hand + symbol to view the differentially expressed genes predicted to be regulated by that TF
-
The TF enrichment is performed using differentially expressed genes with a threshold of 1.5 fold change and an adjusted pvalue ≤0.05 (if applicable)
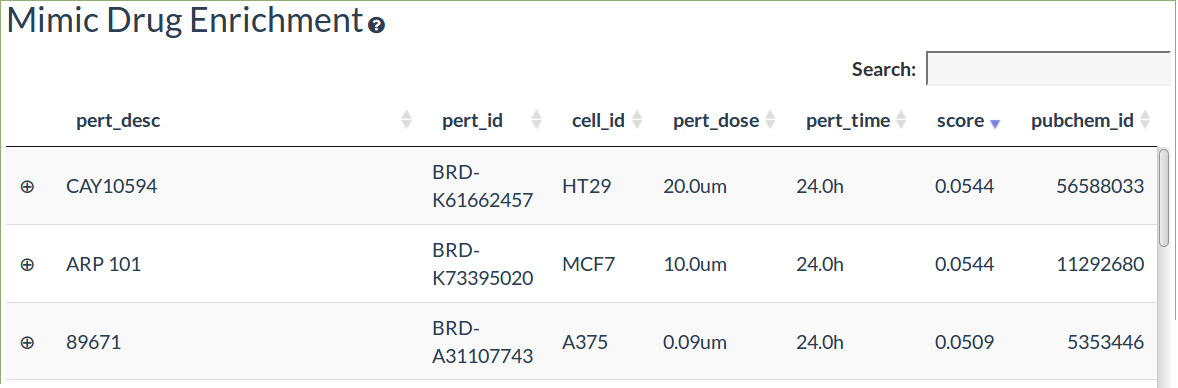
Enriched Drugs
-
The drug enrichment table shows the drugs with overlapping transcriptomic signatures from the L1000CDS2 tool
-
The drug enrichment is performed using differentially expressed genes with a threshold of 1.5 fold change and an adjusted pvalue ≤0.05 (if applicable)
-
The search score is the overlap between the input and drug signature differentially expressed genes divided by the total number of genes
-
Drugs can either mimic the transcriptional response or have the opposite response (reverse)
-
Click on the left hand + symbol to view the overlapping differentially expressed genes and the predicted drug targets
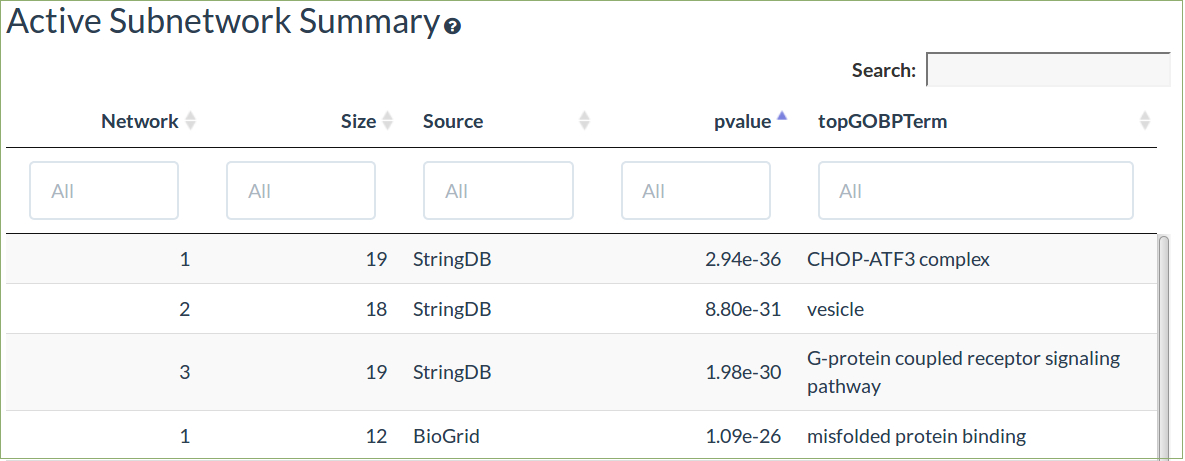
Active Subnetworks
-
The subnetwork table shows a summary of the significant subnetworks (de novo pathways) identified using the GIGA algorithm
-
This algorithm uses all the differential expression data without a threshold
-
The signifcance of the pathway and the top enriched GO term are shown
-
Click on a row to load that subnetwork, the information will be shown and it can now be viewed in the subnetwork tab
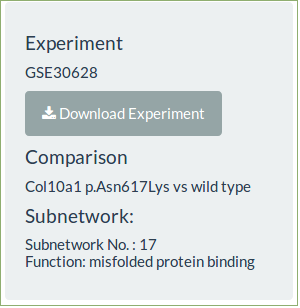
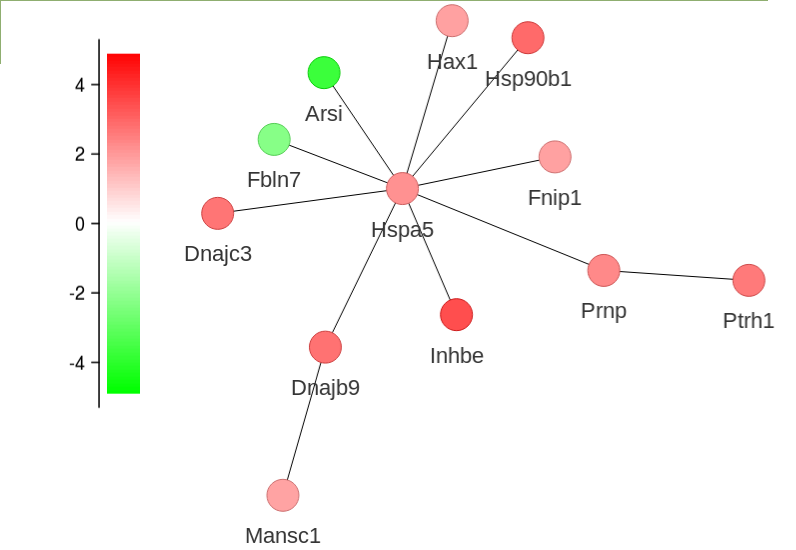
-
The subnetwork can be zoomed, moved around the canvas and each node moved to improve the layout
-
Hover over a node to view the fold change of that node
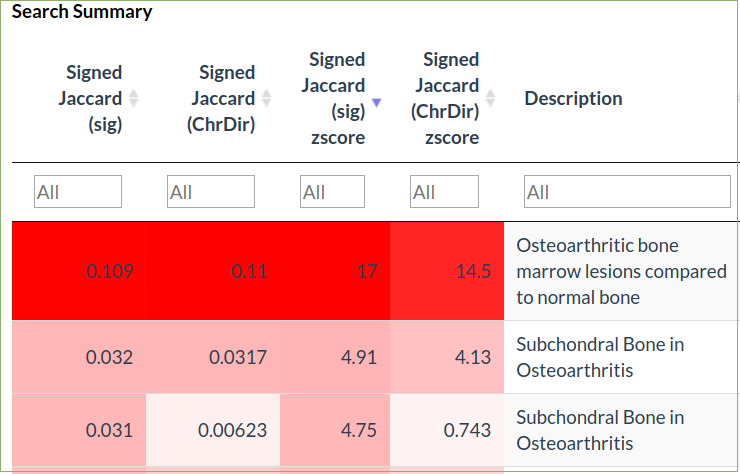
Shared Response
-
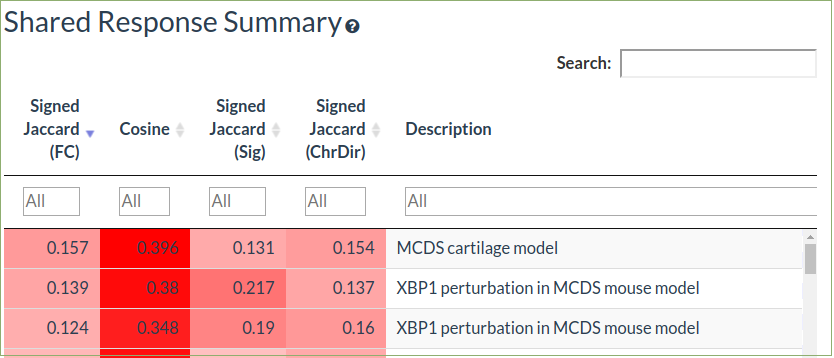
The shared response summary tabs allow comparison of the selected dataset against the other datasets in the database
-
The pairwise comparison tab allows detailed comparison of the selected dataset against a single datasets in the database while the multi comparison allows calculation of consensus signatures and enriched pathways from many datasets
-
The cosine similarity is a measure of correlation of the fold-changes
-
Signed jaccard coefficient is the overlap of up and down differentially expressed genes in the query and comparison datasets
-
Differentially expressed genes are defined using either just a fold-change threshold (1.5 fold) or using both fold-change (1.5 fold) and statistical significance (FDR ≤ 0.05
-
Select a row to choose a comparison dataset for further detail in the comparison tab
-
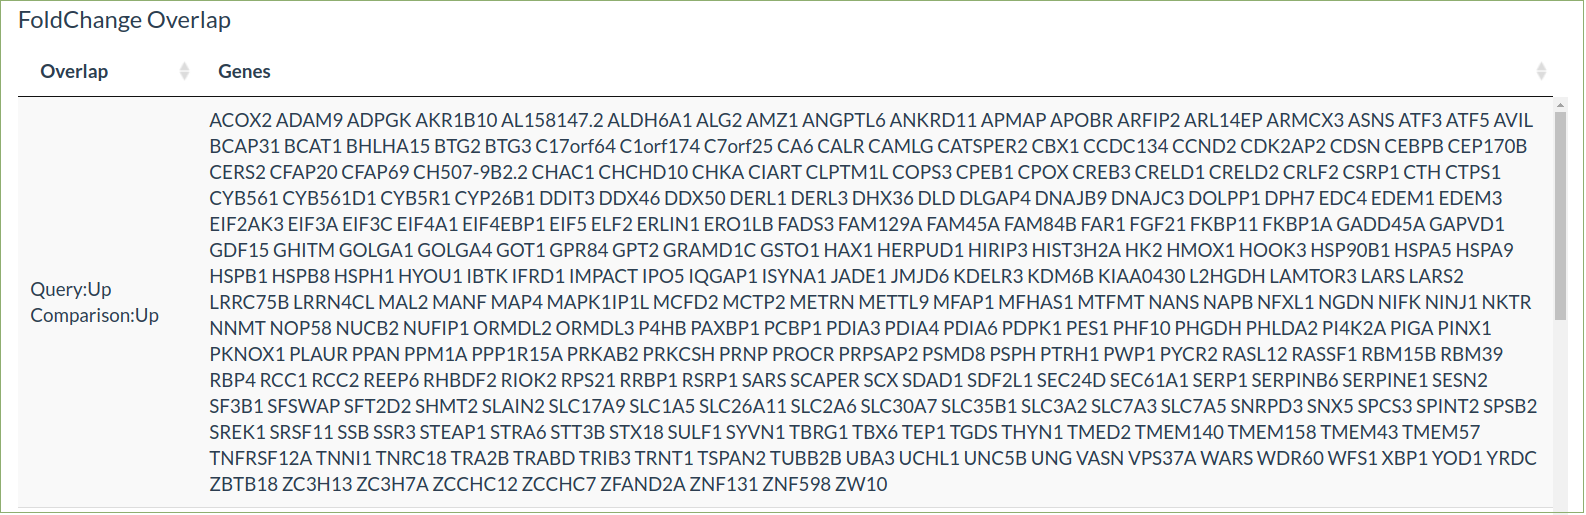
This will show the up and down differentially expressed genes in the query dataset that overlap the selected comparison
-
The cosine and jaccard plots show the distribution of scores over the database
-
Select one or more rows to choose comparison datasets for further detail in the comparison tabs
-
For the fold change signatures the rank product method is used to calculate the consensus probability of the differential expression. For the Characteristic Direction and Differential expression signatures the genes are shwon with their direction of change in each experiment. A p-value or vote threshold can be selected to perform EnrichR pathway enrichment analysis from the consensus signatures.
Compare
-
The compare section of the app allows searching of the database by a gene or by a transcriptomics signature

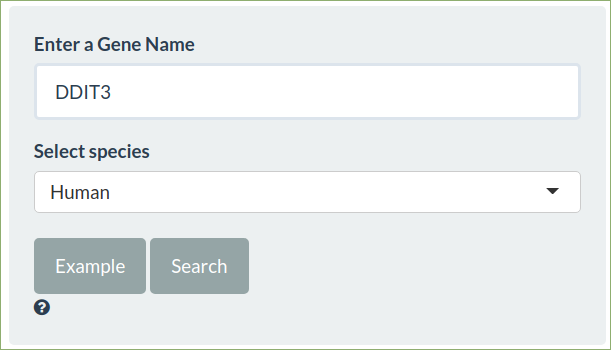
Compare by Gene
-
To search all the fold change tables enter a gene symbol and select the appropriate species
-
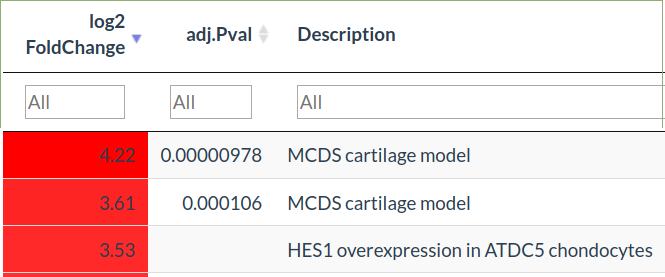
The fold change of that gene in every comparison in all the experiments will be shown
-
Datasets of interest can then be fully explored in the Explore tab
Compare by signature
-
To search all the fold change tables enter the differentially expressed up and down regulated genes and select the appropriate species
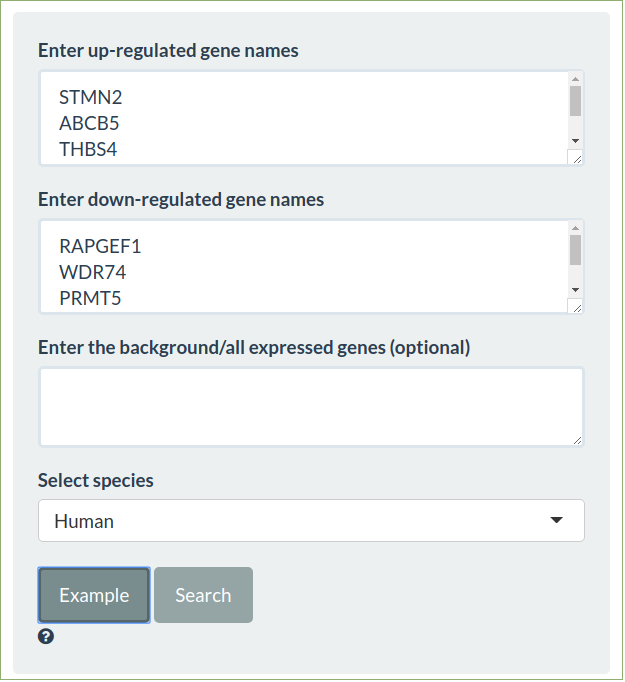
-
The similarity to every other comparison in all the experiments will be shown using the signed jaccard measure for significant differentially expressed genes and characterstic direction signatures
-
Select a row to see the gene overlap for that comparison